Bases Filter Switches
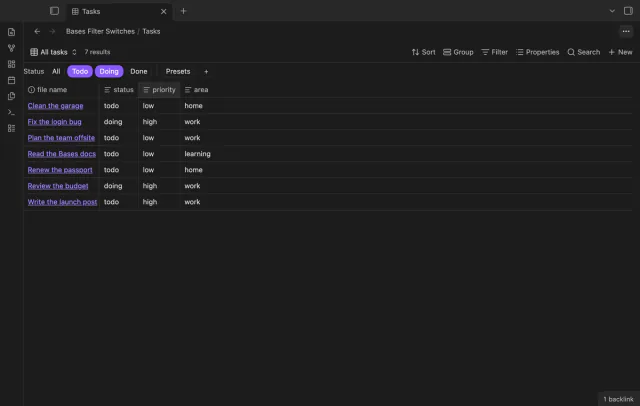
A row of switches under the base toolbar, each one a saved filter you turn on or off with a click.
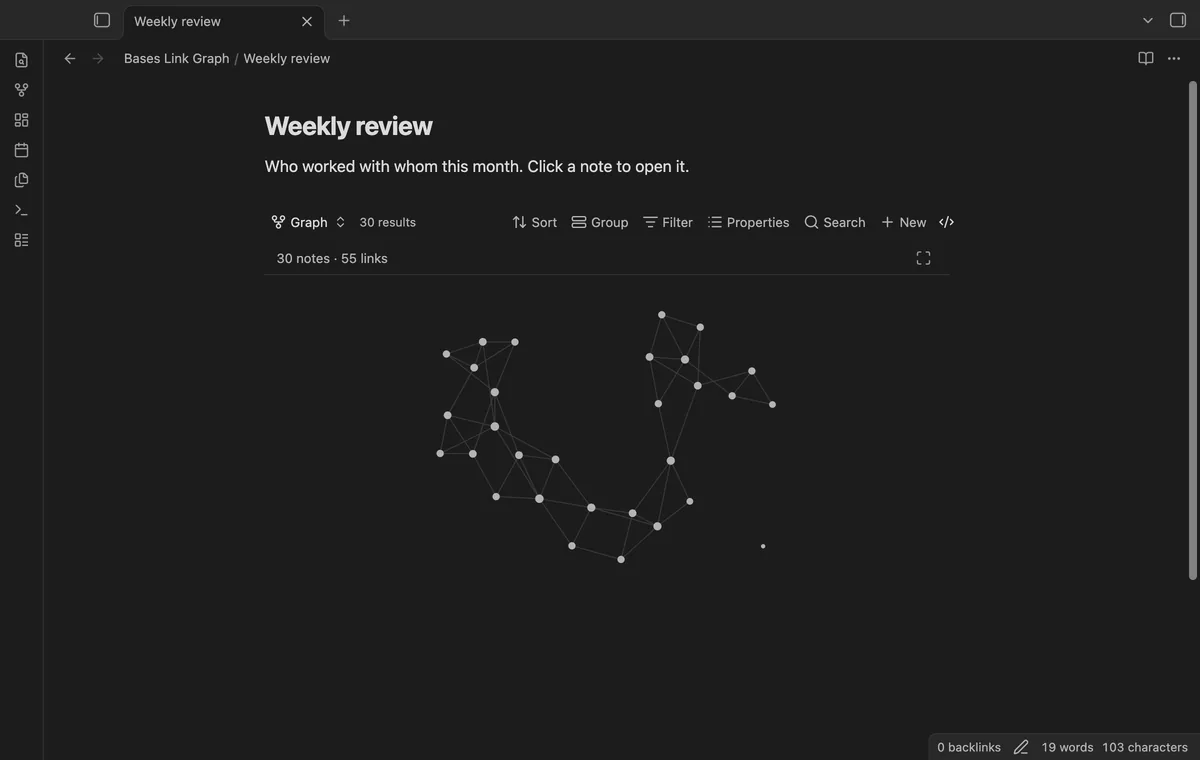
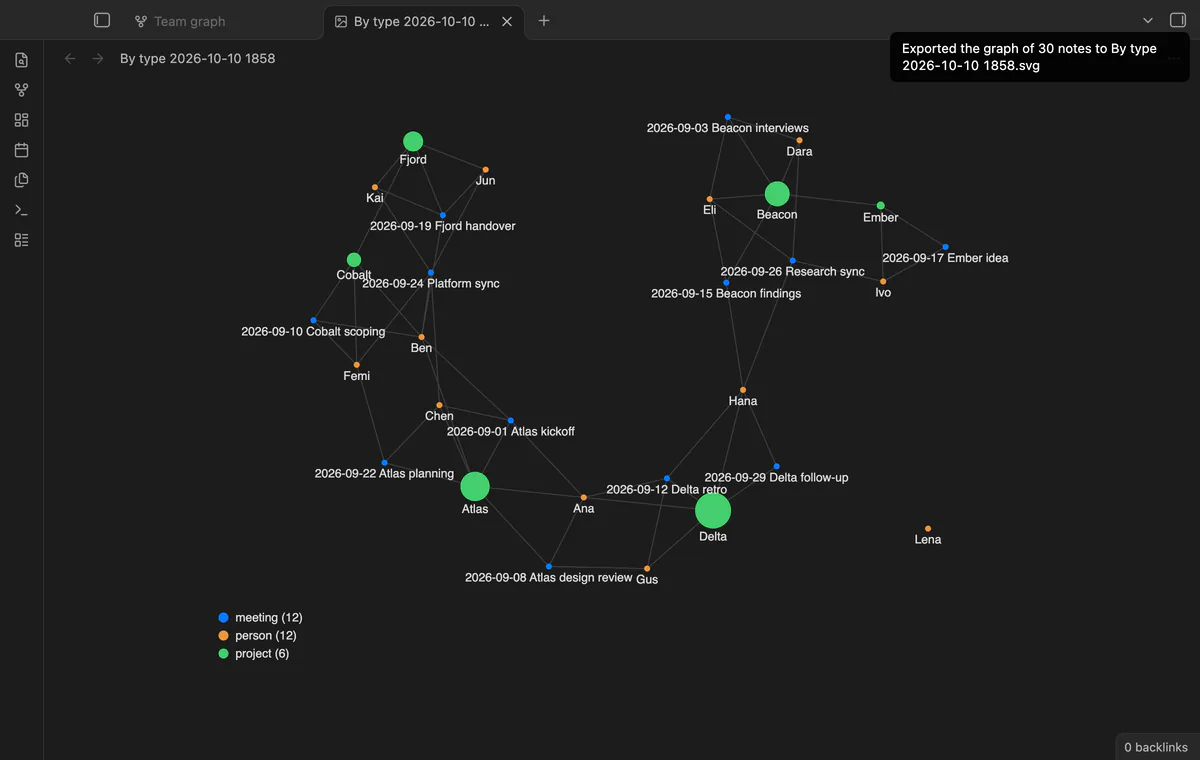
Filter a base, and the graph shows only those notes and the links between them.
MIT · no telemetry · core features free
Directory facts fetched from community.obsidian.md/users/theluckystrike.
Note takers who filter notes with a base and want to spot clusters, gaps and hubs in only those notes.
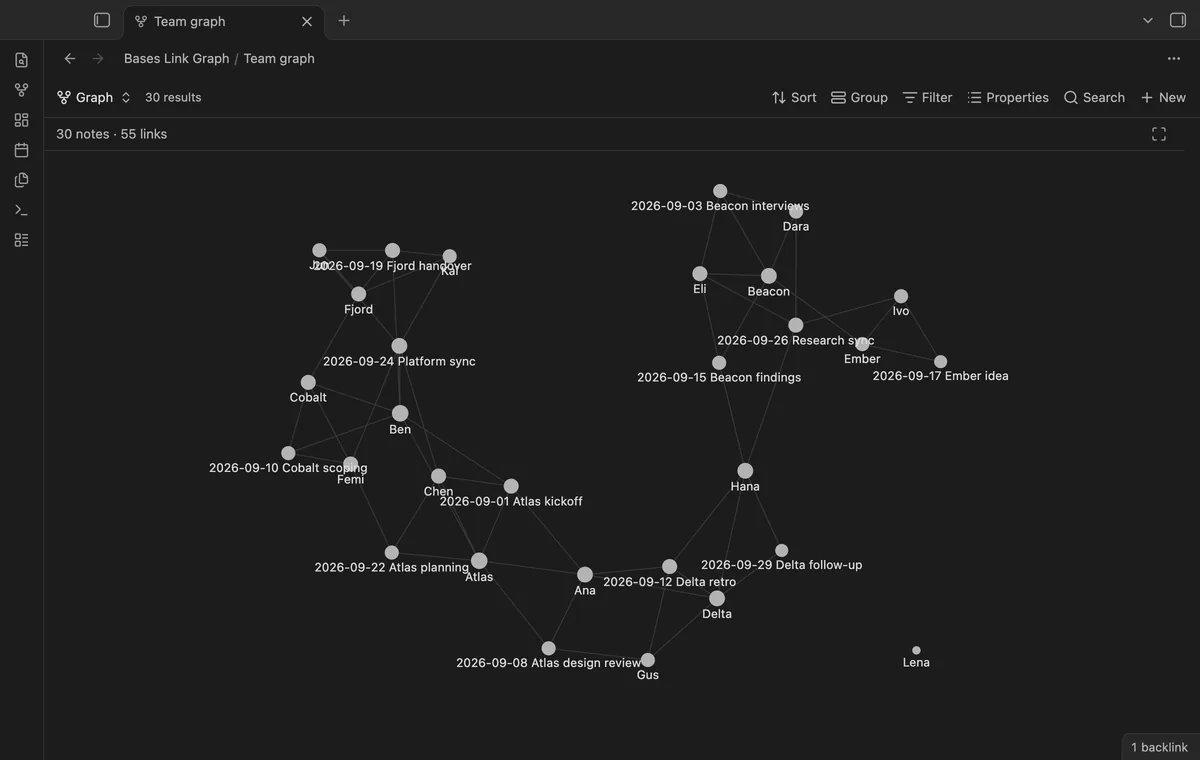
Each note that the base selects is a node, and each link between two of those notes is an edge. Set the filters of the base, and the graph shows only those notes. Links to notes outside the base are left out.
It's a view for the core Bases plugin, and it uses only the public Bases API. The free version has no note limit.
 Play demo
Every row of the base becomes one node, so the node count is the same as the result count. A small force layout places linked notes near each other. Notes with more links are a little larger.
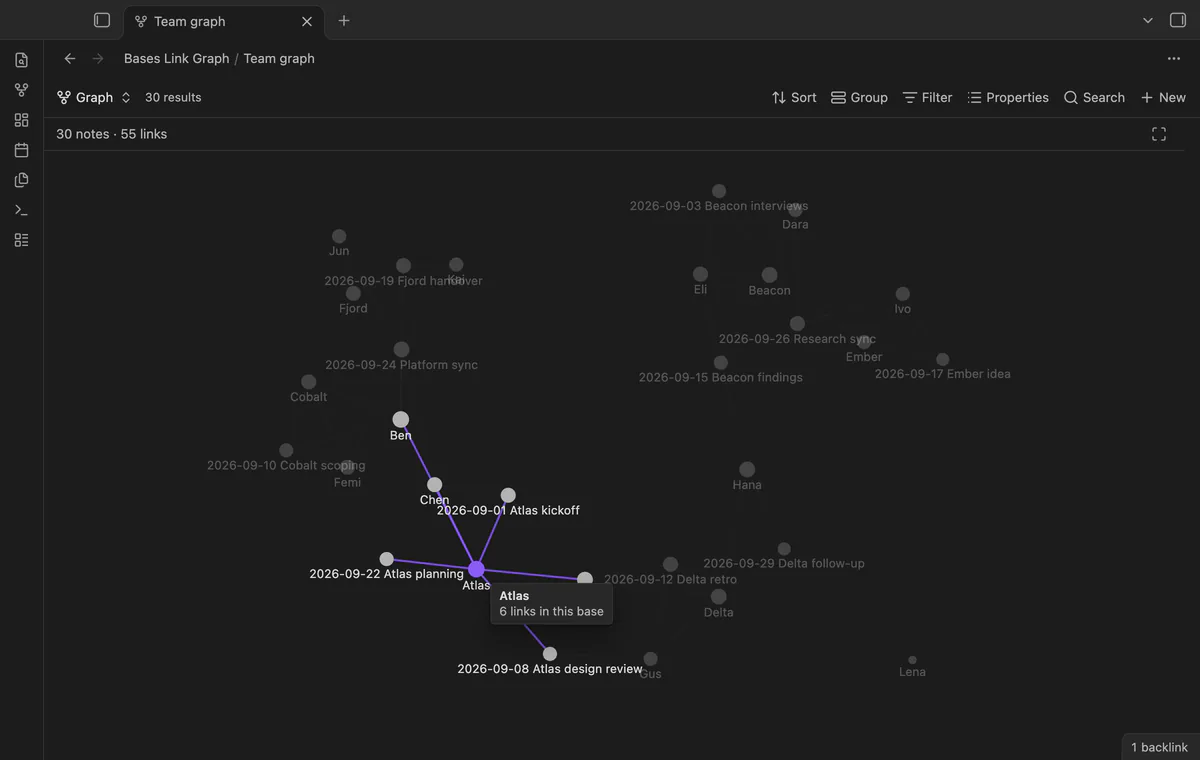
Click a node to open its note. Hover over a node to light up its links and see a card with its name. Scroll to zoom, drag the background to pan, and drag a node to move it.
When you add or remove a link in a note of the base, the graph draws again after a short delay. The nodes keep their place, so the graph doesn't jump. You can embed the view in any note, and the colors follow your theme.
Pro costs $5 a month or $15 one time through GitHub Sponsors. One sponsorship turns on Pro in all 13 plugins.
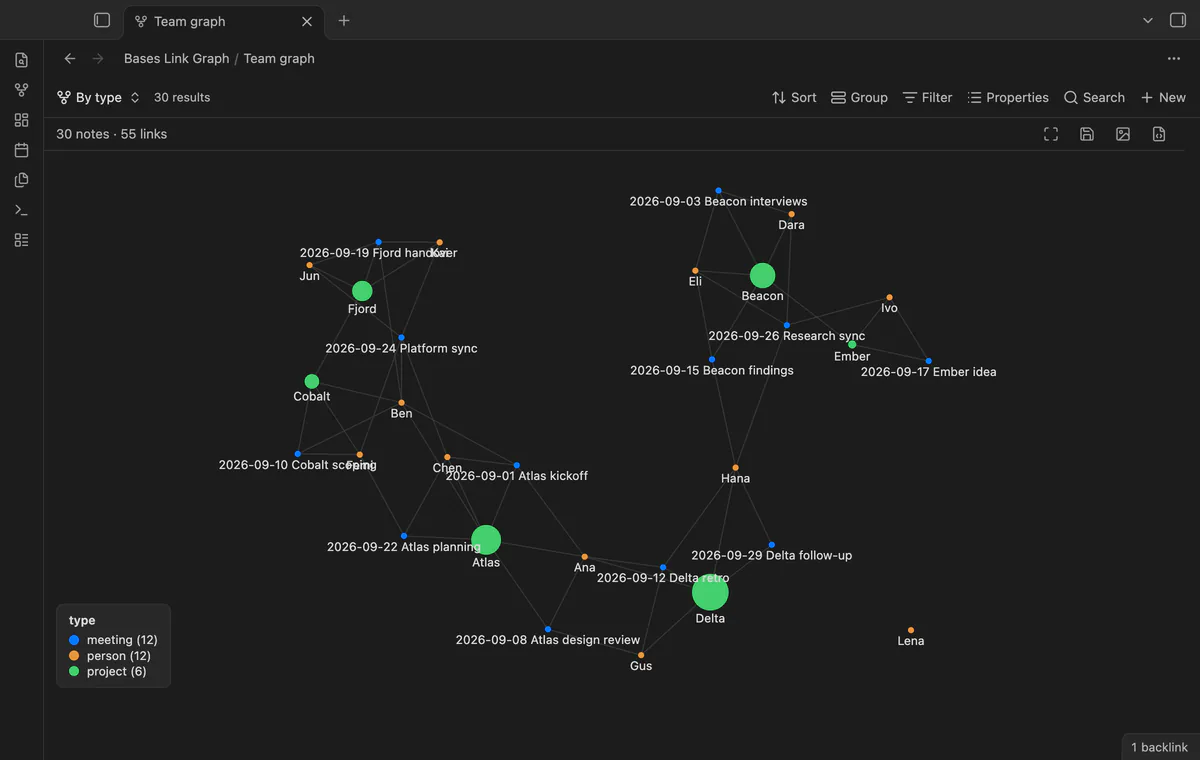
Set Size by to a number property, and the area of each node follows the value. Set Color by to any property, and a legend shows each value and its count. With more than eight values, the less common ones share one Other color.
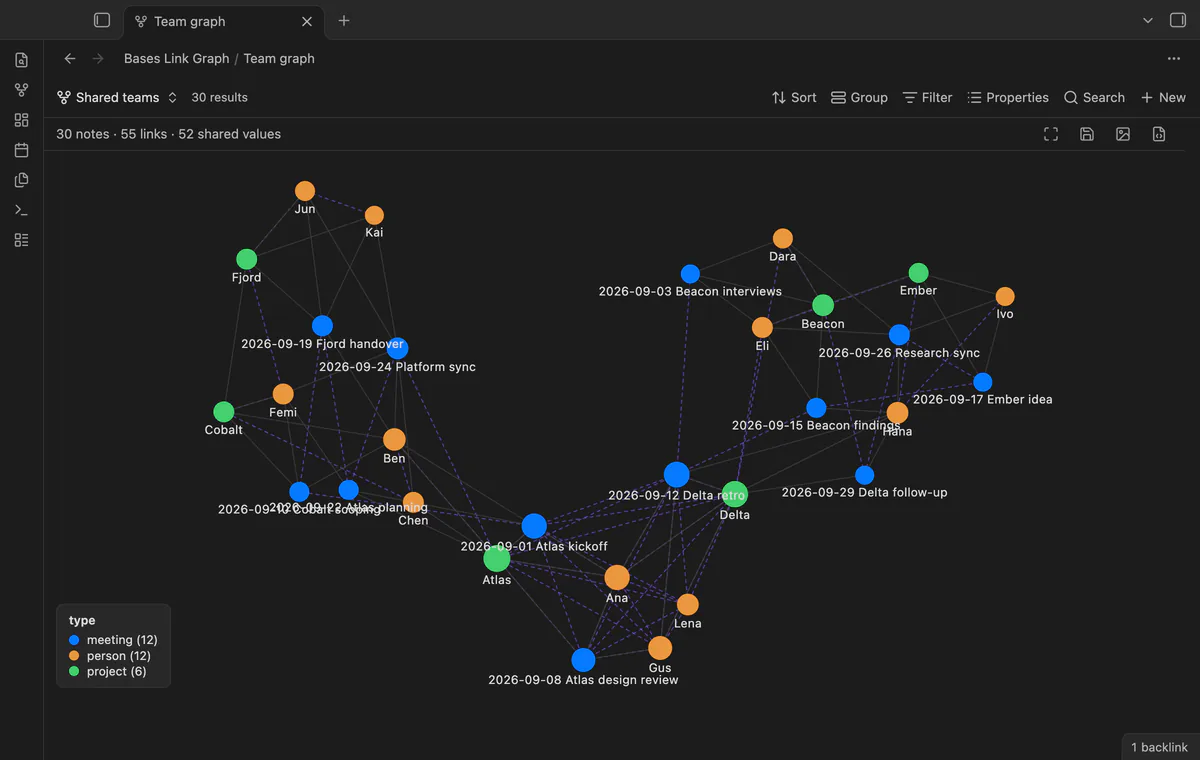
Type one or more property names, such as team or tags, and notes with the same value get a dashed edge. Case, a leading # and wikilink brackets don't matter. A value that more than 12 notes share joins them in a chain.
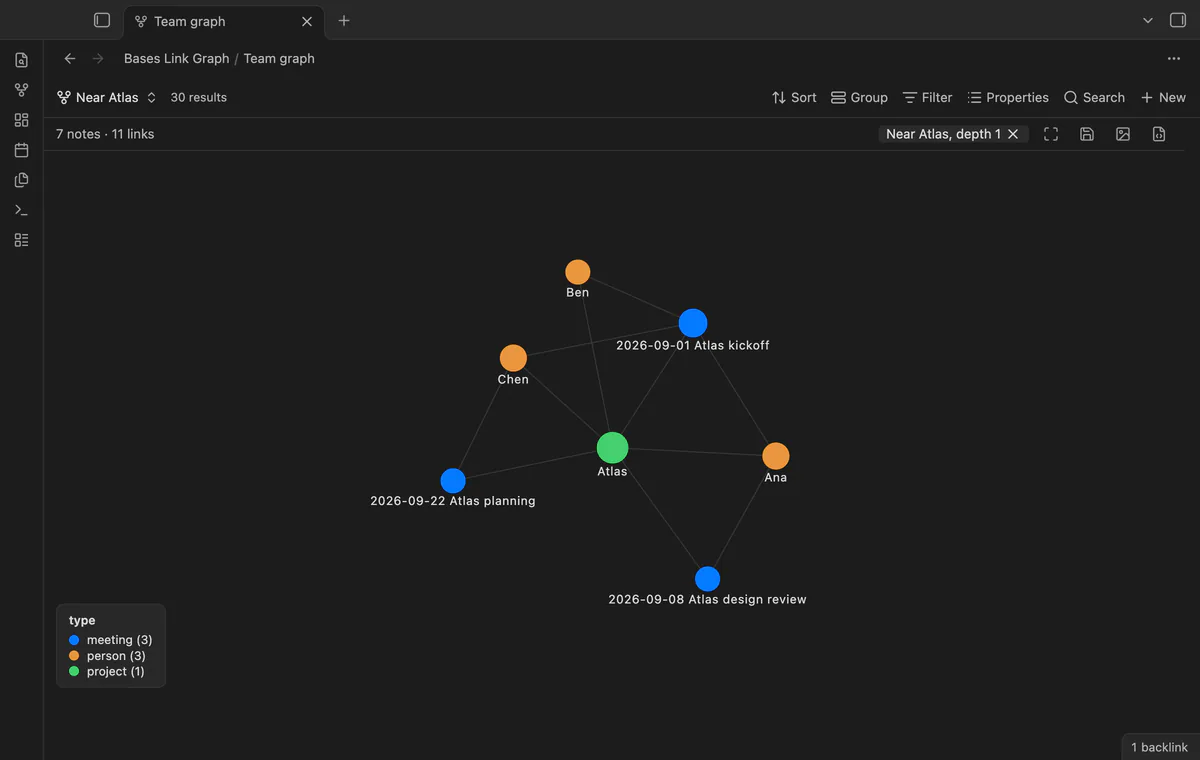
Right-click a node and select Show only notes near this one. The graph then shows that note and the notes up to N edges away, in both directions. The Local depth slider sets N, up to 5.
Export the graph to a PNG image or an SVG file, with every label. The SVG file also has the legend. Save layout keeps the place of each node in the base file, so the graph opens in the same shape.
needs
steps
Create a base, or open one, and set its filters so that it selects the notes you want to see.
Select the view menu in the base toolbar and add a view of the type Link graph.
Open the view options to choose the labels and the link length.
Forum topic 104414, a request to put a graph view in the view menu of a base, has 34 votes and 63 likes. The core graph view shows the whole vault or the local graph of one note.
The core graph view shows the whole vault or the local graph of one note. Bases Link Graph shows exactly the notes of a base, with the base filters.
The free version has no note limit. The base limit applies, so when the base shows the first 100 results, the graph has 100 nodes. In the end-to-end test with 500 notes and 1,490 links, the graph was built in 2 ms. The layout warm-up took about 55 ms, on an M3 Pro Mac.
No. Saved layouts and view options go in the base file. Export creates a new file.
Bases Link Graph makes no network requests until you select Sign in with GitHub. After sign in, it sends one query about your sponsorship to the GitHub API, at most once every 7 days. It sends no note content, file names or other vault data, and it has no telemetry.
Bases Link Graph 1.0.0, MIT license
MIT · no telemetry · core features free
A row of switches under the base toolbar, each one a saved filter you turn on or off with a click.
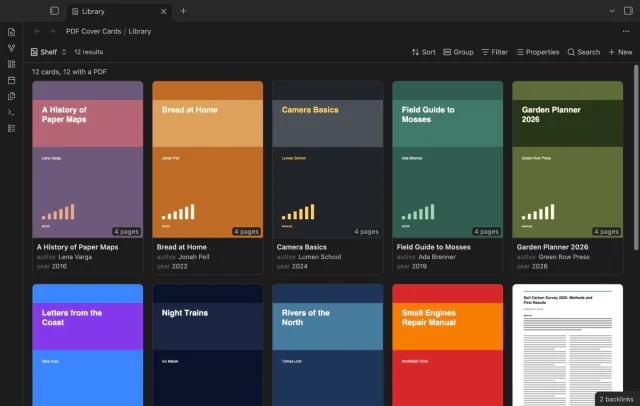
Your base of book and paper notes looks like a shelf, with page 1 of each PDF as the cover.
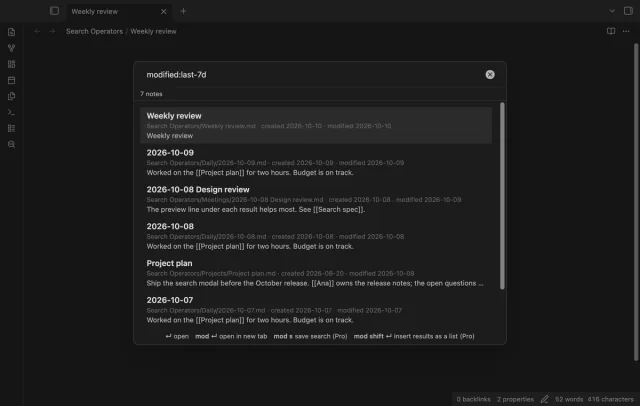
Find a note by when you made or changed it and by what it links to, with a preview line per result.