How to get a graph view of the notes in an Obsidian base
As of October 2026, Bases has no graph layout of its own, and its help page lists table, list, cards, Kanban and map. At least three community plugins add a graph of a base. Two of them, Base Graph and Graph Explorer Base View, are free.
Updated · 4 ways compared · 5 sources
Background
The request "Base: Add a Graph View (put graph view in base's view menu)" was opened on 2025-08-21. It has 63 likes and 17 posts. Posters want the base filters to choose the nodes, and several also want a depth setting like the one in the local graph.
Two posters describe the stopgap. You rebuild the base filters as a search term in the core graph, then bookmark that graph. One of them calls it painstaking and notes that a number range can't be written as a search.
4 ways to do it
The core graph with a search filter
Open the core Graph view and type a search term under Filters, in Search files. The help page says this filters the notes in the graph. Groups can color notes by a search term too.
For one note and its neighbors, run Open local graph and set the depth slider.
limits
You keep two definitions, the base filters and the search term, and you update both by hand. A poster in September 2025 said some base filters, such as number ranges, can't be written as a search.
Base Graph is a free community plugin that adds a Graph view to Bases. Its README says the notes a base returns are drawn as a force-directed graph, and the graph follows the toolbar filters.
It can also show notes up to 5 links away from the results and give each group of the base a color. A number property can set the node size, and ring and layered layouts are options.
limits
Its README lists no image export and no saved node positions, as of October 2026. It needs Obsidian 1.10.2 or later.
This free community plugin also draws the notes of a base as a force-directed graph. Its README adds an explored flag and a maturity level for each note, both kept in the note's front matter.
Nodes can take their color from tags or from any property, and node positions are saved for each view.
limits
Its README offers node size by link count or one size for all, not by a property. It needs Obsidian 1.13.0 or later.
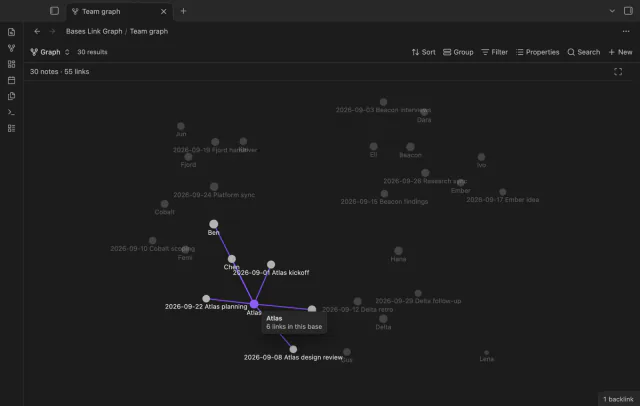
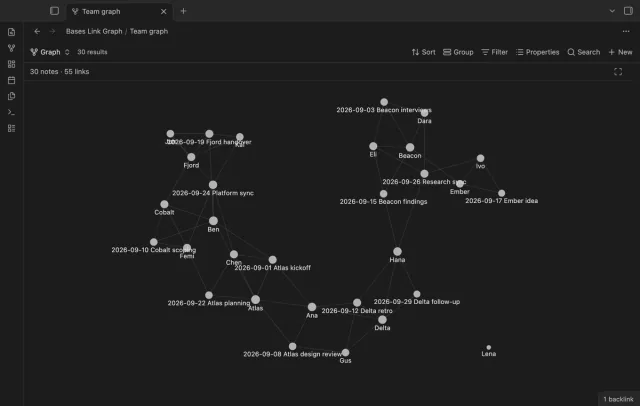
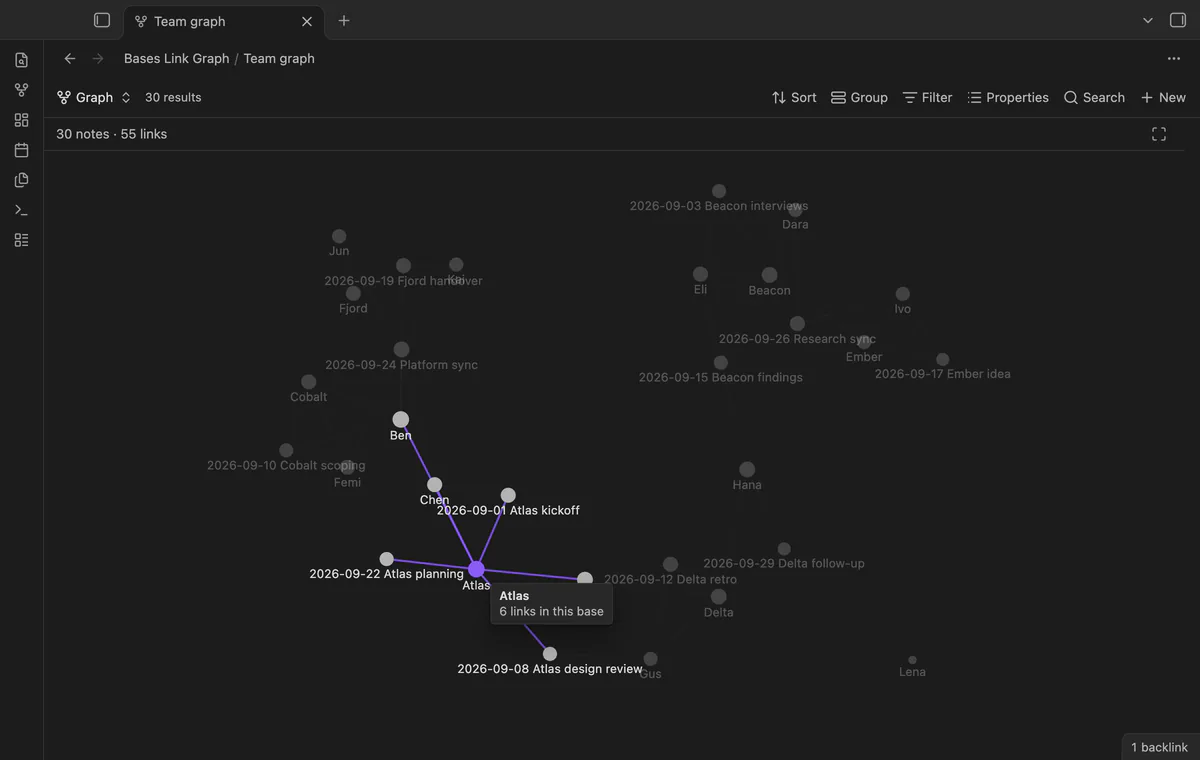
Bases Link Graph adds a view type named Link graph. Every row of the base is one node, and a link between two notes of the base is an edge. Links to notes outside the base are left out.
The free version has no note limit. It includes labels, zoom, pan, drag, click to open, hover preview, embeds and live update.
limits
Size and color by a property, edges between notes that share a value, local depth, image export and saved layouts need Pro. The graph never adds notes from outside the base.
Install Bases Link Graph from Community plugins and enable it. The core plugin Bases must be on.
Create a base, or open one. Set its filters so that it selects the notes you want to see.
Select the view menu in the base toolbar and add a view of the type Link graph.
Open the view options to choose the labels and the link length.
Click a node to open its note, or hover over it to light up its links.
The options Size by, Color by, Join notes that share and Local depth need Pro. Without Pro the graph ignores them.
Common questions
Which graph plugins for Bases are free?
Base Graph and Graph Explorer Base View are free, going by their READMEs in October 2026. Bases Link Graph draws the graph for free and charges for its extras. Color by group and size by a property cost nothing in Base Graph. In Bases Link Graph, size and color by a property need Pro.
Can the graph also show notes outside the base?
Base Graph can. Its Depth option adds notes up to 5 links away and draws them faded. Bases Link Graph keeps to the notes of the base. Several posters in the thread asked for the depth behavior, so check which one you want.
Can I export the graph of a base as an image?
Bases Link Graph exports a PNG or an SVG file, and that needs Pro. The READMEs of Base Graph and Graph Explorer Base View list no image export, as of October 2026. The help page for the core Graph view describes none.
Does the graph update when I change a link?
In Bases Link Graph it does. The graph draws again after a short delay when you add or remove a link in a note of the base. The nodes keep their place, so the picture doesn't jump.
Core search has no operator for the created or modified date, as of October 2026. It can sort results by either time, and it can match a date written in a file name, the text or a property. For a real date filter you use a base, a Dataview query or a search plugin.
A core base can't do it, as of October 2026. The help page says the table shows a row for each file, so a list property stays in one cell. Dataview's FLATTEN command gives a row for each item outside Bases, and the Flatten Table plugin does it inside a base.
The core Cards layout can't draw a PDF page, as of October 2026. Its help page lists a link to a local attachment, an external URL and a hex color as cover values. A forum poster reported in July 2025 that only PNG and JPG scans show as covers.